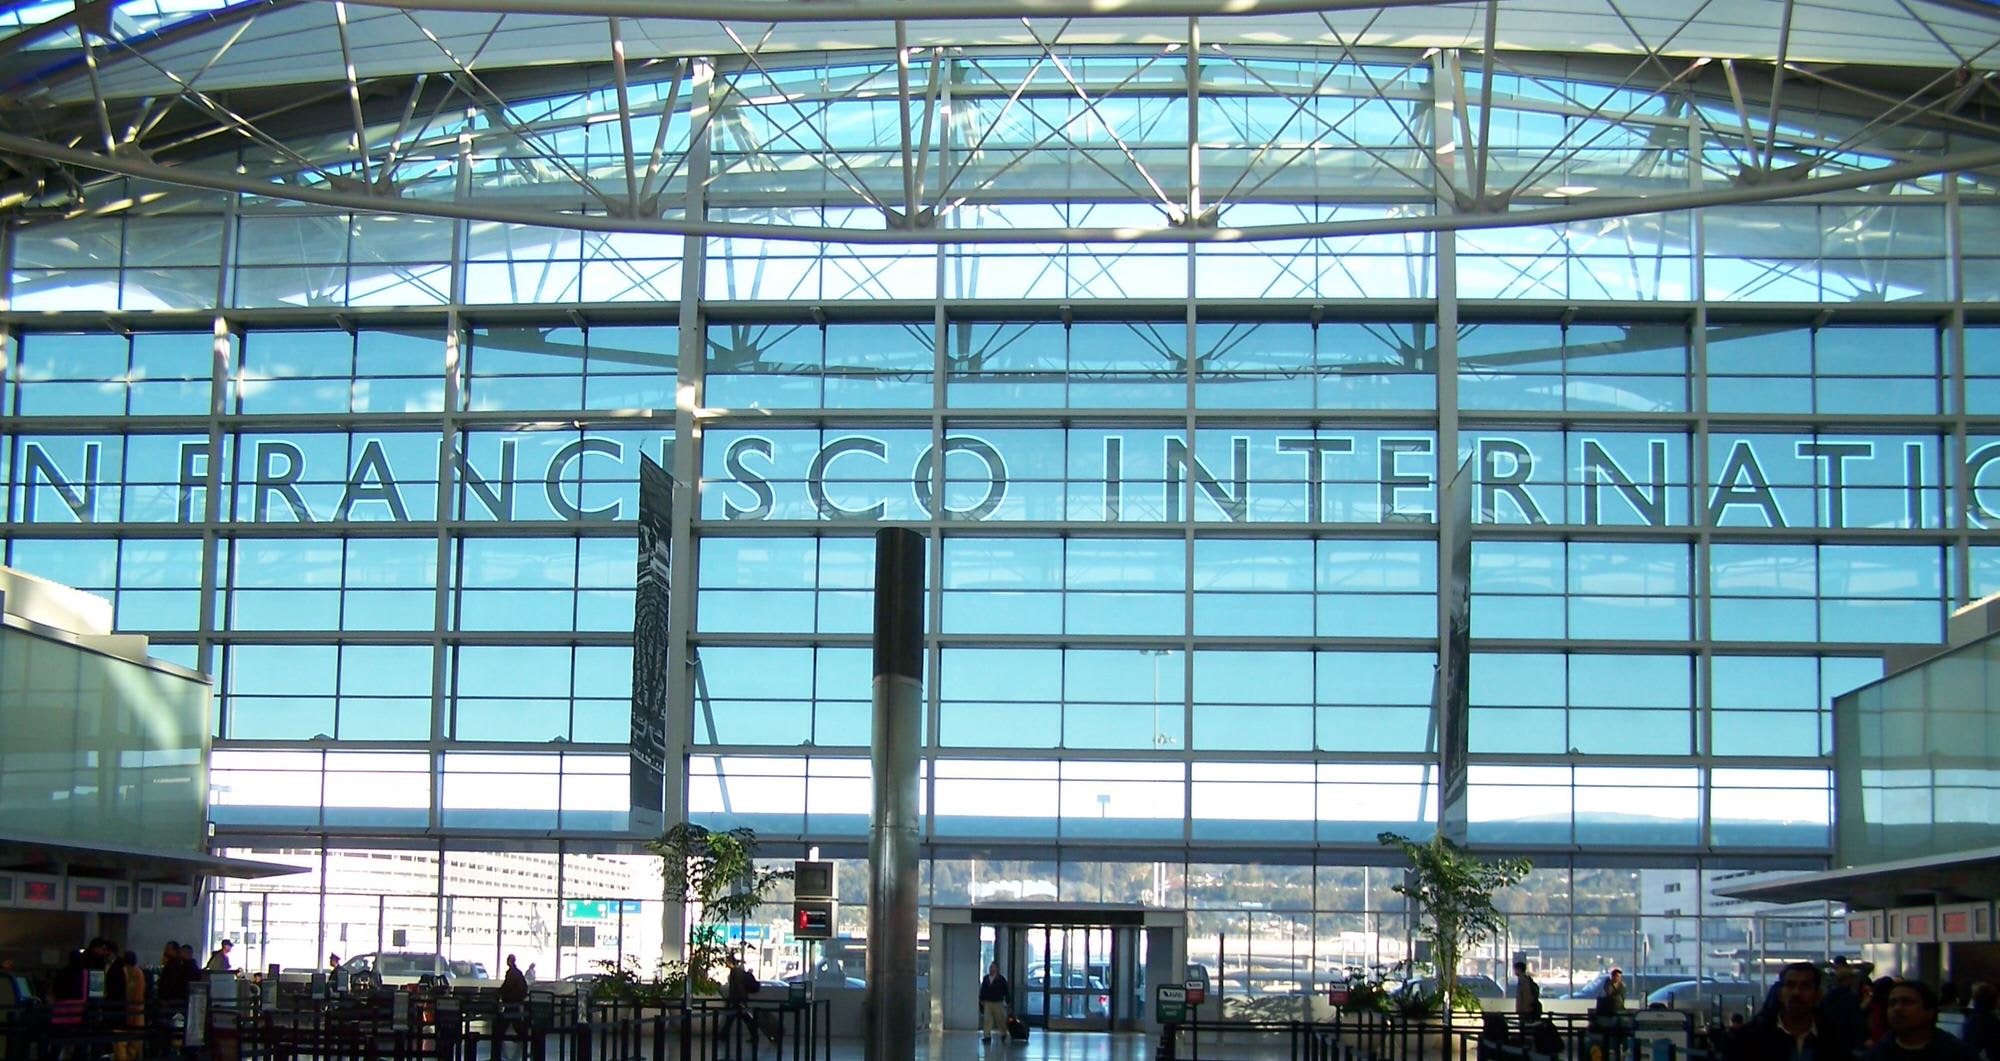
Perched 14 miles south of downtown on San Francisco Bay, San Francisco International Airport (SFO) serves as the primary commercial airport for Northern California. With nearly 58 million passengers annually, SFO is the fifth busiest airport in the US and seventh busiest in North America. Let’s fly through SFO’s history, vital stats, and benchmark its rankings nationally and continentally.
The Evolution of SFO’s Distinctive Infrastructure
Before concrete, airmail pilots used water runways at the Marina neighborhood starting in 1927 while land runways operated initially from Mills Field. After moving temporarily to Tanforan Racetrack in San Bruno, the City built Mills Field Municipal Airport on Bay fill by 1927. After rapid 1930s growth, Mills Field needed upgrades so in 1954 ground broke on Nimitz Road for the Central Passenger Terminal. The $27 million site took 3 years featuring:
• Distinctive hexagon-shaped terminals
• Soaring control tower with panoramic views
• Sophisticated technological features
Renamed after San Francisco in 1955, the airport expanded heavily post 1950s and built additional halls and concourses through the decades. Seismic and infrastructure upgrades like AirTrain and Airport hotel also enhanced needs. Currently, SFO spends over $1 billion through their Capital Improvement Plan to continually modernize terminals and transportation.
Fast Facts on Current Scope and Dimensions
Before seeing how SFO stacks up for traffic nationally and continentally, let’s spotlight key metrics and infrastructure strengths:
• 4 lengthy runways (~11,000 ft) handle 1500 daily arriving/departing flights
• 90+ carriers operate across domestic and global routes
• Oversaw 56 million+ passengers in 2022 supporting 400+ businesses
• $100 million+ annual local economic impact
• $7.2 billion planned in capital investments through 2028
Benchmarking Versus Other Top U.S. / North American Airports
So how does SFO’s enplanements and operations compare sized up against rivals?
By total passengers per year:
• 7th nationally
• 5th in North America
For yearly takeoffs and landings:
• 16th nationally
• 14th in North America
Cargo traffic comparative ranks:
• 10th nationwide (~400k metric tonnes)
• 8th across North America
No doubt SFO punches above its weight serving Northern California passenger and cargo needs while connecting the West Coast to worldwide air networks. Though not first nationally, it leads the region and houses iconic architectural landmarks like Terminal 2 that reminds travelers of San Francisco’s signature local style blended into air travel’s modern necessities.
Wherever your SFO travels may take you, do take a moment before that boarding call to appreciate the ingenuity that raised this airport from bay waters into the iconic gateway it remains today. And for those Silicon Valley tech workers taking off routinely each week, remember airline innovation started decades ago by daring trailblazers at places like Mills Field!


0 Comments